Data synchronization dashboard
- name:
- Data synchronization dashboard
- description:
- Get an overview of all your data synchronizations at a glance
- version:
- 1.2.0
- release:
- 2022-02-09
- itop-version-min:
- 2.7.0
- code:
- combodo-data-synchronization-dashboard
- state:
- stable
- alternate-name:
- Synchro Dashboard
- diffusion:
- Client Store, iTop Hub
- php-version-max:
- PHP 8.0
For iTop from 2.5.0 to 2.6.5, use 1.1.x
For iTop 2.7.0 or higher, use this version or above
To do so, check the
/extensions and
/data/production-modules folders for a
itop-synchro-dashboard folder and
remove it, otherwise the setup will fail.This extension provides an extra menu (under the Admin tools section) linking to a page that provides an overview of all Data Synchro Sources (last run, number of replicas, number of errors…)
Features
A quick overview to check the health of the running data synchro sources.
Revision History
| Date | Version | Description |
|---|---|---|
| 2022-02-09 | 1.2.0 | Fix compatibility with iTop 3.0 |
| 2020-03-13 | 1.1.1 | Move menu entry to the new “Configuration” group |
| 2018-07-13 | 1.1.0 | Fix compatibility with iTop 2.5. Fix wrong warning counts in table. Remove manually 1.0.0 version before installing |
| 2014-08-29 | 1.0.0 | First version |
Limitations
-
This extension does NOT replace the standard “Synchronization Data Sources” menu (it inserts its own menu “Synchronization Dashboard” just below)
-
The extension does not trace the history of the execution of the tasks (see the task's detailed status for this information).
-
The extension is localized in English and French only.
Requirements
iTop 2.5+
Installation
Use the Standard installation process for this extension.
Configuration
This extension has no configuration setting.
Usage
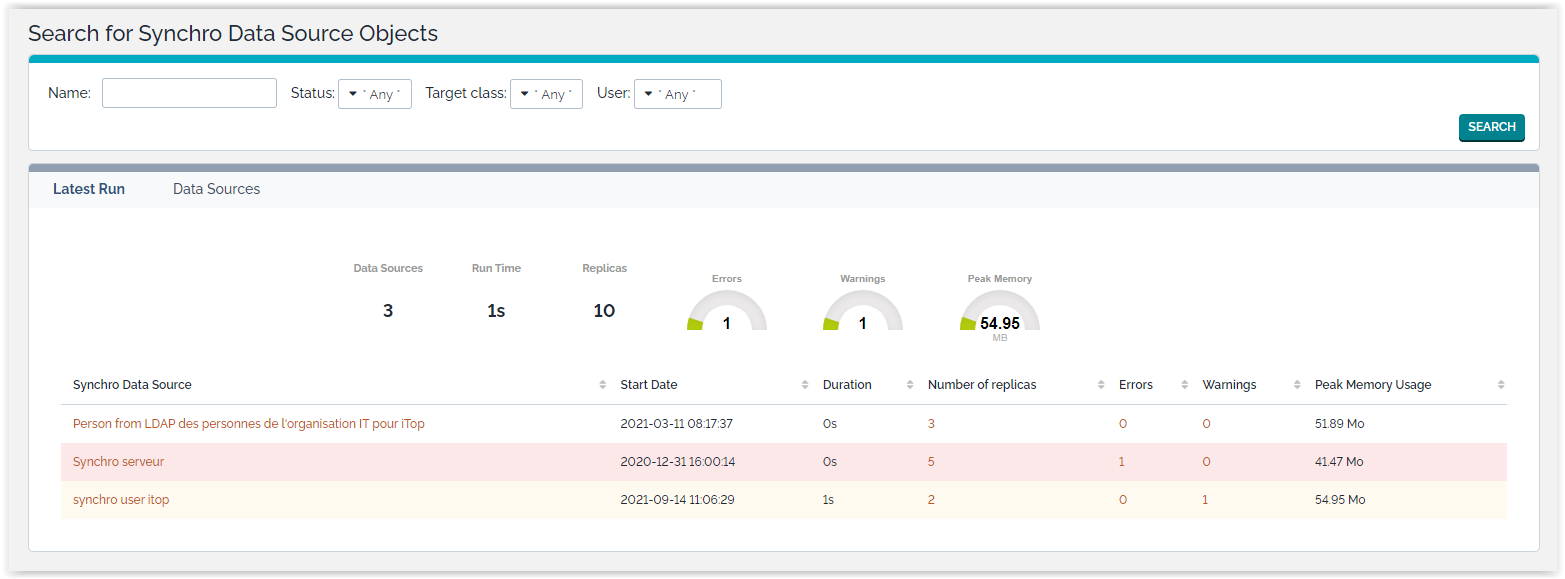
Click on the menu “Admin Tools / Synchronization Dashboard” to display the following page:
The first tab shows the list of all the Synchronisation Data Sources with 6 overall indicators:
| Data Sources | The total number of data sources |
| Run Time | The cumulated run time of the last time each data source was run |
| Replicas | The total number of replicas for all the data sources |
| Errors | The cumulated number of errors for all data sources, for their latest run |
| Warnings | The cumulated number of warnings for all data sources, for their latest run |
| Peak memory | The highest amount of PHP memory used by a data source during its latest run |
The list under the indicators shows the same metrics, for each data source.
The second tab is simply the list of data sources.
Using the “search” form at the top of the page it is possible to filter the list of data sources. The filter also applies to the overall statistics.

