Portal: How to add a dashlet
In this How to, we will add a dashlet in the portal using the ManageBrick. A dashlet can be either a pie chart, a bar chart, a top_list or a badge.
- name:
- How to add a dashlet
- type:
- How To
- audience:
- Administrator, Integrator, Developer
- level:
- Advanced
- duration:
- 30min
- keyword:
- Portal, Customization
- iTop version:
- 2.5.0
This dashlet now comes
natively with iTop 2.5 and above.
Prerequisites
What you will need to:
-
Have an iTop system with the demo data and the enhanced portal installed,
-
Have access to an account with enough rights to connect to the portal (usually this means having the
Portal
User
profile), -
Have a way to modify the datamodel definition (creating an extension or with ITSM Designer)
Aim of this tutorial
In this tutorial, you will learn how to:
-
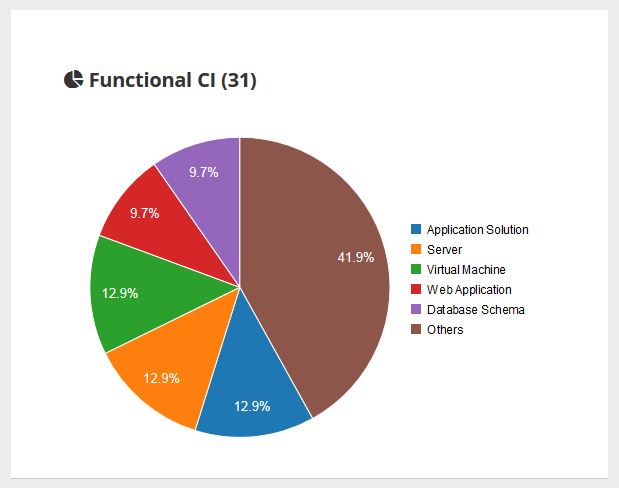
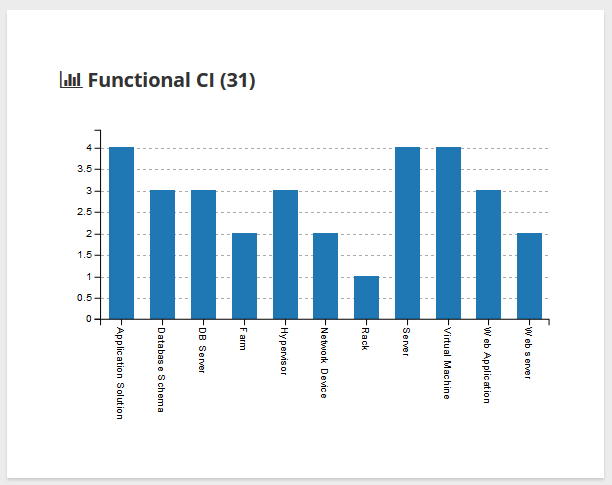
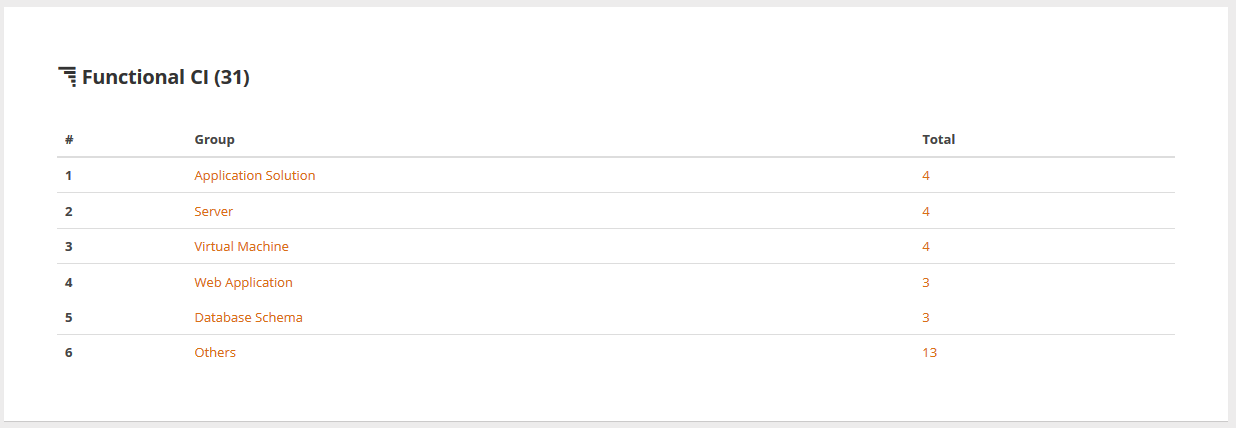
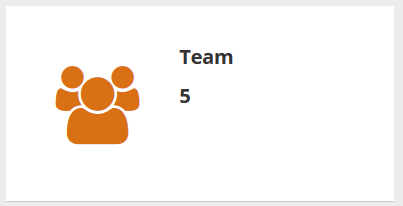
Add a new dashlet to the existing portal, which looks like the following screenshots:
-
Pie chart:
-
Bar chart
-
Top list
-
Badge
-
Default tile
Example of Ongoing Ticket ManageBrick
To add a pie chart tile to the homepage of the standard user
portal, to display open versus resolved
Tickets in a pie chart. Put this XML code into an extension, run
the setup and check the result in the portal.
- production.delta.xml
-
<?xml version="1.0" encoding="UTF-8"?>
<itop_design xmlns:xsi="http://www.w3.org/2001/XMLSchema-instance"  version="1.0">
  <module_designs>
    <module_design id="itop-portal" xsi:type="portal">
      <bricks>
        <brick id="ongoing-tickets-for-portal-user-ext" xsi:type="Combodo\iTop\Portal\Brick\ManageBrick" _delta="define">
        <active>true</active>
        <rank>
          <default>20</default>
        </rank>
        <width>6</width>
        <title>
          <default>Brick:Portal:OngoingRequests:Title</default>
        </title>
        <description>Brick:Portal:OngoingRequests:Title+</description>
        <decoration_class>
          <default>fa fa-etsy fa-2x</default>
        </decoration_class>
        <oql><![CDATA[SELECT Ticket]]></oql>
        <!-- Optional tag to define if the action should be done in a modal window ("modal"), a new window ("new") or the current window ("self") -->
        <!--<opening_target>modal</opening_target>-->
        <!-- Optional tag to define the how the objects should be opened. Values can be edit|view. Note that even if this is set to edit, objects not allowed in edition mode for the user (cf. scopes and security layers) will open in view mode -->
        <!-- <opening_mode>edit</opening_mode> -->
        <!-- Can be either a class tag with the class name or an oql tag with the query -->
        <!-- <class>Ticket</class> -->
        <!-- Optional tag to add attributes to the table by their code -->
        <fields>
          <field id="title"/>
          <field id="start_date"/>
          <field id="status"/>
          <field id="service_id"/>
          <field id="servicesubcategory_id"/>
          <field id="priority"/>
          <field id="caller_id"/>
        </fields>
        <!-- Optional: display type can be 'pie-chart', 'bar-chart', 'list' -->
        <display_modes>
          <!-- How the data can be displayed in the ManageBrick -->
          <availables>
            <mode id="list"/>
            <mode id="pie-chart"/>
            <mode id="bar-chart"/>
          </availables>
          <!-- How the ManageBrick get displayed by default when open -->
          <default>pie-chart</default>
          <!-- How the ManageBrick is displayed in the Homepage and in an AggregatePageBrick -->
          <!-- Possible values are text|badge|pie-chart|bar-chart|top-list -->
          <tile>badge</tile>
        </display_modes>
        <!-- Optional: way to define the export to Excel -->
        <export>
          <!-- Optional tag to export attributes by their code -->
          <fields>
            <field id="title"/>
            <field id="start_date"/>
            <field id="status"/>
            <field id="service_id"/>
            <field id="servicesubcategory_id"/>
            <field id="priority"/>
            <field id="caller_id"/>
            <field id="description"/>
          </fields>
          <!-- Optional way to tell that the export uses default fields -->
          <!-- <export_default_fields>true</export_default_fields> -->
        </export>
        <grouping>
          <!-- Mandatory -->
          <tabs>
            <!-- Optional. Show object count for each tabs. Available values are true|false. Default is false. -->
            <show_tab_counts>true</show_tab_counts>
            <!-- Mandatory. Grouping by tabs -->
            <!--<attribute>operational_status</attribute>-->
            <!-- attribute xor groups tag -->
            <!-- Optional way to limit the number of groups when grouping with attribute -->
            <!-- <limit>5</limit> -->
            <!-- Optional when limit given, display the aggregation of the remaining groups -->
            <!-- <show_others>true</show_others> -->
            <groups>
              <!-- Can be used only with ../oql tag, not ../class tag. Reason is that we can't know the class alias to apply to the condition's fields. We might have an exception saying that the field in ambigious for the generated query. -->
              <group id="opened">
                <rank>1</rank>
                <title>Brick:Portal:OngoingRequests:Tab:OnGoing</title>
                <condition><![CDATA[SELECT Ticket AS T WHERE operational_status NOT IN ('closed', 'resolved')]]></condition>
              </group>
              <group id="resolved">
                <rank>2</rank>
                <title>Brick:Portal:OngoingRequests:Tab:Resolved</title>
                <condition><![CDATA[SELECT Ticket AS T WHERE operational_status = 'resolved']]></condition>
              </group>
            </groups>
          </tabs>
          <!-- Implicit grouping on y axis by finalclass -->
        </grouping>
        <data_loading>full</data_loading>
      </brick>
      </bricks>
    </module_design>
  </module_designs>
</itop_design>
Of course this is just an example, play and twist it to get what you want.
Enabling export to Excel
You can add the “export to Excel” feature on each ManageBrick.
The feature supports two ways to define the attributes to export:
-
Using the same attributes as displayed in the page:
<brick xsi:type="Combodo\iTop\Portal\Brick\ManageBrick">
  <export><export_default_fields>true</export_default_fields>...
-
Using a specific list of fields for the export, which will be different than what is displayed in the list:
<brick xsi:type="Combodo\iTop\Portal\Brick\ManageBrick">
  <export><fields><field id="title"/>....
This will display an export button on the corresponding pages:
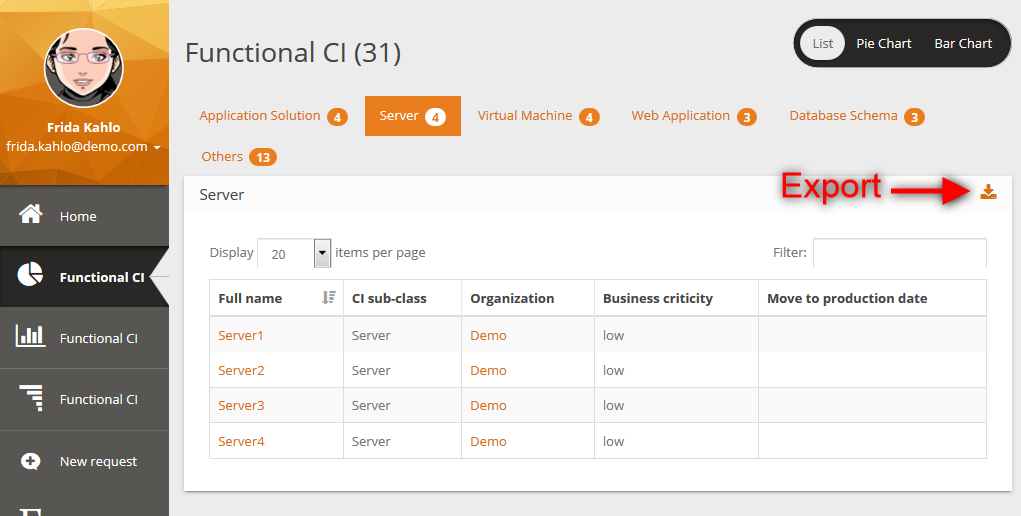
You have to select either
explicit
fields list or the tag
export_default_fields in order to allow export.
2_7_0/customization/portal_howto_add_manage_extended_brick.txt
· Last modified: 2020/04/15 15:23 by 127.0.0.1

