Resolution delay taking Coverage window into account
Prerequisite: You must be familiar with the Syntax used in Tutorials and have already created an extension.
In this tutorial, we suppose that you are calculating TTO and TTR taking into account Coverage Window, using SLA considering business hours extension, and you want to display the time spent let say in TTR, but ignoring the non-working periods.
Within a stopwatch we have 4 internal sub-items:
| Code | Label | Meaning |
| timespent | Elapsed | total time spent within the states associated with the stopwatch - not accurate if stopwatch is running! |
| started | Started | when the stopwatch has started for the first time |
| laststart | LastStart | when the stopwatch has started for the last time - empty if stopwatch is stopped |
| stopped | Stopped | when the stopwatch was stopped for the last time - empty if stopwatch is running |
Resolution delay will give you the time between
those two internals: ttr_started and
ttr_stopped. But that may not be what you want as this
delay is the total time between those two events. It does not take
into account the fact that maybe the TTR was stopped during that
period, and it ignores coverage window.
If what you want is the real time spent by your support team to
resolve a ticket then use the timespent SubItem. For
this you must declare it in XML as a field of the UserRequest
class
- itop_design / classes / class@UserRequest
-
   <fields>
     <field id="tto_timespent" xsi:type="AttributeSubItem" _delta="define">
     <target_attcode>tto</target_attcode>
     <item_code>timespent</item_code>
     </field>
    </fields>
You may display it or not in the details screen of a UserRequest, it will anyway be available in “Customize this list” view, in dashlets and OQL queries.
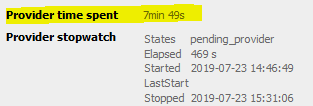
Here is an example of a timespent display versus
stopwatch display:
-
The stopwatch was started and stopped multiple times, as a result, “Elapsed” does not correspond to the difference between “Started” and “Stopped”
-
7*60s + 49s = 469s: Provider time spent is just a nice display of the “Elapsed” sub-item
-
It's an extract from this tutorial: Flag Tickets waiting for a 3rd party