Editing Dashboards
Some of the pages in iTop are dashboards. Dashboards are used to display information about different iTop objects on the same page. Most of the overview pages, as well as the welcome page are dashboards. In iTop 2.0, each user can configure their own dashboards by editing the existing dashboard pages. It is not possible to create new dashboard pages.
When a page is an editable dashboard, the small 3 dots menu at the top-right of the page, show a dropdown menu item to create a custom version.

After a few seconds a popup dialog appears containing the dashboard editor dialog:

A dashboard is made of building blocks named after dashlets.
A dashboard itself arranges the display of the dashlets it contains. A dashboard has only three properties:
-
A layout (one, two or three columns)
-
An optional title
-
The automatic refresh setting (disabled, or refresh interval given in seconds)
The layout determines how the dashlets are arranged on the page: it determines a grid, with each dashlet being assigned to one cell of the grid. When the layout is changed, the cells (as well as the dashlets inside the cells) are re-organized to produce the desired display.

To edit the properties of a dashlet, click on it in the left part of the dialog. An orange border appears around the selected dashlet, and the properties of the dashlets are displayed on the right part of the dialog. To modify the appearence of the dashlet, simply modify the properties on the right. The dashlet will change to reflect your modifications. To remove the selected dashlet from the dashboard, click on the red cross at the top-right of the selected dashlet.
To add a new dashlet to the dashboard, drag one of the dashlet icons into the desired area of the dashboard, then adjust the properties on the right to finalize your dashboard.

When you are done with editing, click on Save to save your modifications and go back to the iTop page.
To undo all modifications performed since clicking on Edit this page, click on Cancel.
Dashlet types
The following types of dashlets are available to compose your dashboard:
| Icon | Name | Description |
|---|---|---|
 |
Text | A free text area. Use this dashlet to add a title or a comment to a page |
 |
Object List | A list of iTop objects, displayed as a table, like any search result |
 |
Pie Chart | A list of itop objects, grouped on the given field and displayed as a pie chart. New in 2.5: Instead of the count, various functions can be used (sum, average, min and max) on specified fields. The ordering direction can also be specified and the max number of results. |
 |
Bar Chart | A list of itop objects, grouped on the given field and displayed as a barchart. New in 2.5: Instead of the count, various functions can be used (sum, average, min and max) on specified fields. The ordering direction can also be specified and the max number of results. |
") |
Group By | A list of itop objects, grouped on the given field and displayed as a table. New in 2.5: Instead of the count, various functions can be used (sum, average, min and max) on specified fields. The ordering direction can also be specified and the max number of results. |
 |
Header | A grey banner with an icon on the left and a title. |
 |
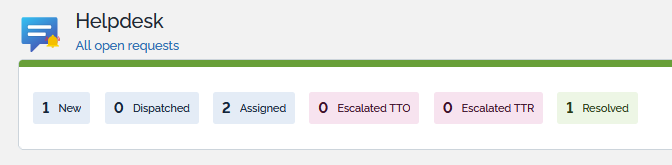
Header with counts | A grey banner with an icon on the left, title and a table showing the count of objects grouped by a given field. |
| Badge | A icon with a text showing the total number of objects of the given class and two links: 'create a new…' and 'search for…' |
Dynamic Dashlet
If the Dashboard is a Menu dashboard then you can
use the 2 first methods
Based on Current user
:current_contact->id: This is the id of the contact linked to the connected user, it's 0 if no contact is associated to the user. It allows to display the Tickets for which the current user is the agent for eg.
SELECT Ticket WHERE agent_id = :current_contact->id
Based on Time
In the below OQL example, we display Tickets created in the past 30 days and not yet closed
SELECT Ticket
WHERE creation_date > DATE_FORMAT(DATE_SUB(NOW(), INTERVAL 30 DAY),'%Y-%m-%d 00:00:00')
AND STATUS != 'closed'
Based on Current object
Only available for Dashboard Attribute defined on an Object, you can filter your OQL using any field of the current Object.
For example on Organization, you can use placeholders like
:this->att_code where
att_code can be any field of the Organization, including
the id.
SELECT UserRequest WHERE org_id=:this->id
Edit the custom version
Once you have created a custom version of a particular
dashboard, then you can only edit the custom version 
Switching between versions
At any time while browsing a dashboard you can switch the dashboard display from your custom version to the standard one and vice versa.
-
The icon with the building in orange is used to tell you that you are on the standard version:

-
The icon with the person in orange is used to say that you are looking at the custom version:

Exporting a dashboard
-
A dashboard definition can be exported as an XML file, for archiving or sharing it with other users.
-
To export a dashboard, click on the menu item Export to file….
-
When prompted, enter the download location (Where the exported dashboard will be saved to on your computer).

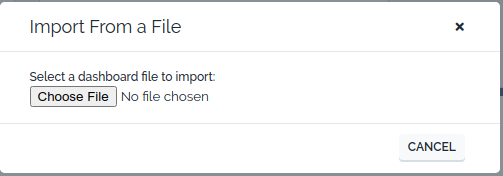
Importing a dashboard

To import a dashboard definition from an XML file, click on Import from file… and select the XML file to upload from your computer.
If you import a dashboard on a dashboard menu that you have not yet customized, it will create a custom version automatically.
Export it before, if you want to keep it.
Printing a dashboard
You can select the paper orientation, then use the print menu of your browser:

Discarding the customizations
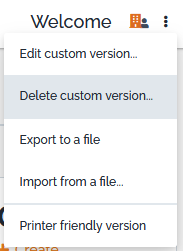
At any time, the customization of a dashboard can be discarded. Simply click on Delete Custom Version… and acknowledge the confirmation popup dialog.
Advanced customizations
Spliting cells
Sometimes it's a bit difficult to reorganize a dashboard manually, especially if you have a lot of dashlets within a cell and want to split them in multiple cells.
-
On your dashboard, select the action
Export
to a file…
and save the file on your PC -
Edit it with a XML editor and enter a piece of code below, where you want to split the cell
-
Each time you paste that code, replace X with a unique number to identify the new cell and its order in the dashboard
-
-
Save the file
-
On your iTop dashboard select the action
Import from a file…and upload the saved XML file
- Cell separator
-
      </dashlets>
    </cell>
    <cell id="X">
      <rank>X</rank>
      <dashlets>
Example of XML file describing a dashboard
- dashboard export
-
<?xml version="1.0"?>
<dashboard xmlns:xsi="http://www.w3.org/2001/XMLSchema-instance">
  <layout>DashboardLayoutOneCol</layout>
  <title>Menu:WelcomeMenuPage</title>
  <auto_reload>
    <enabled>false</enabled>
    <interval>300</interval>
  </auto_reload>
  <cells>
    <cell id="0">
      <rank>0</rank>
      <dashlets>
        <dashlet id="1" xsi:type="DashletHeaderStatic">
          <rank>0</rank>
          <title>Menu:ConfigManagementCI</title>
          <icon>../images/icons/icons8-database.svg</icon>
        </dashlet>
        <dashlet id="2" xsi:type="DashletBadge">
          <rank>1</rank>
          <class>BusinessProcess</class>
        </dashlet>
        <dashlet id="3" xsi:type="DashletBadge">
          <rank>2</rank>
          <class>ApplicationSolution</class>
        </dashlet>
        <dashlet id="4" xsi:type="DashletBadge">
          <rank>3</rank>
          <class>Contact</class>
        </dashlet>
        <dashlet id="5" xsi:type="DashletBadge">
          <rank>4</rank>
          <class>Location</class>
        </dashlet>
        <dashlet id="7" xsi:type="DashletBadge">
          <rank>5</rank>
          <class>Server</class>
        </dashlet>
        <dashlet id="8" xsi:type="DashletBadge">
          <rank>6</rank>
          <class>NetworkDevice</class>
        </dashlet>
<!-- You want to split here -->
        <dashlet id="11" xsi:type="DashletHeaderDynamic">
          <rank>0</rank>
          <title>Menu:RequestManagement</title>
          <icon>itop-welcome-itil/images/user-request-deadline.svg</icon>
          <subtitle>Menu:UserRequest:OpenRequests</subtitle>
          <query>SELECT UserRequest WHERE status != "closed"</query>
          <group_by>status</group_by>
          <values>new,assigned,escalated_tto,escalated_ttr,resolved</values>
        </dashlet>
        <dashlet id="12" xsi:type="DashletObjectList">
          <rank>1</rank>
          <title>UI:WelcomeMenu:MyCalls</title>
          <query>SELECT UserRequest AS i WHERE i.agent_id = :current_contact_id AND status NOT IN ("closed", "resolved")</query>
          <menu>true</menu>
        </dashlet>
      </dashlets>
    </cell>
  </cells>
</dashboard>
Ordering status
-
The values order when editing in the UI the dashlet, may not be the one you want and the UI does not let you re-organize them.
-
There is a workaround, through XML edition using the same process as above.
-
This work is lost each time you edit this dashlet in the UI again 😦 as it reorder using alphabetic order
<values>assigned,dispatched,escalated_tto,escalated_ttr,new,resolved</values>
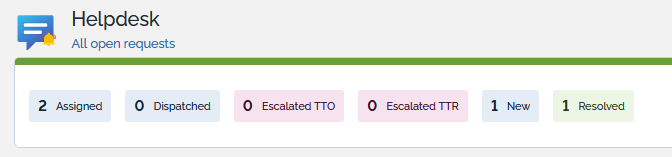
        <dashlet id="11" xsi:type="DashletHeaderDynamic">
          <rank>0</rank>
          <title>Menu:RequestManagement</title>
          <icon>itop-welcome-itil/images/user-request-deadline.svg</icon>
          <subtitle>Menu:UserRequest:OpenRequests</subtitle>
          <query>SELECT UserRequest WHERE status != "closed"</query>
          <group_by>status</group_by>
          <values>new,dispatched,assigned,escalated_tto,escalated_ttr,resolved</values>
        </dashlet>