Counting time waiting for 3rd party
Prerequisite: You must be familiar with the Syntax used in Tutorials and have already created an extension.
- learning:
- Count time spent by Ticket within particular state(s)
- level:
- Advanced
- domains:
- XML, Stopwatch, Automation, Lifecycle
- min version:
- 2.3.0
Goal
In this tutorial, we want to track how much time was spent waiting for the provider on each ticket. This requires to:
-
Add a stopwatch attribute on UserRequest class, to count when the ticket is in “pending_provider” state.
-
Add a sub-item field to display the time spent while waiting for provider.
-
Display the total time spent waiting for the 3rd party provider only in some states of the UserRequest
And we assume that we have added a "pending_provider" state and 2 transitions before.
with the Designer
Prerequisite: You must be a Combodo's customer
Add a Stopwatch
To create a stopwatch, click on the small  button next to
the title “Stopwatches” in the bottom pane.
button next to
the title “Stopwatches” in the bottom pane.

Give it a code, a label and select the state(s) in which the
stopwatches should be running, here just
pending_provider 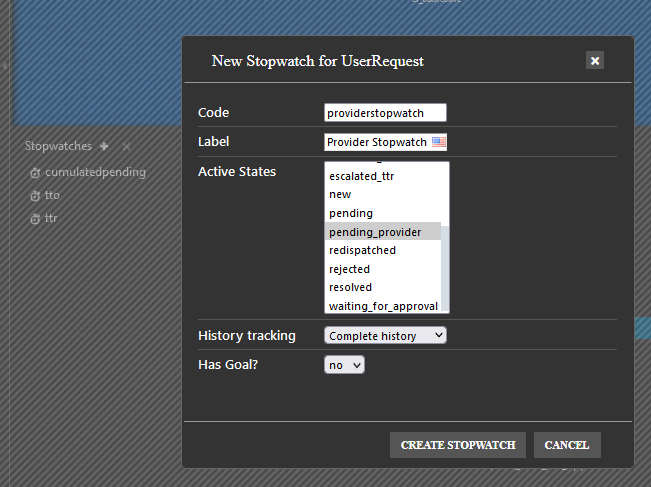
Track time spent
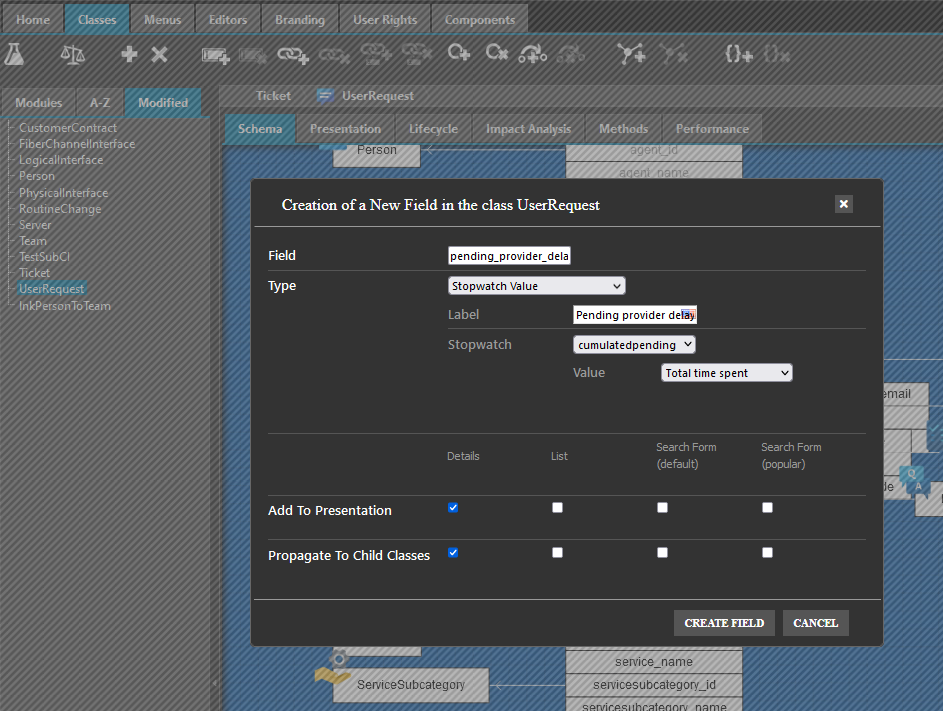
On the class UserRequest, press the new field icon: 
In the pop-up window, enter or select
-
Field =
pending_provider_delay -
Type =
Stopwatch Value -
Stopwatch = Select the stopwatch, in our case
pending_provider(and not thecumulatedpendingof the screenshot) -
Value =
Total time spent
Display Stopwatch
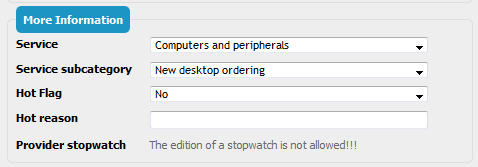
Add this field to the presentation / details view.
In the schema tab, select the field
pending_provider_delay, hide this field in states
where the stopwatch is not pertinent.
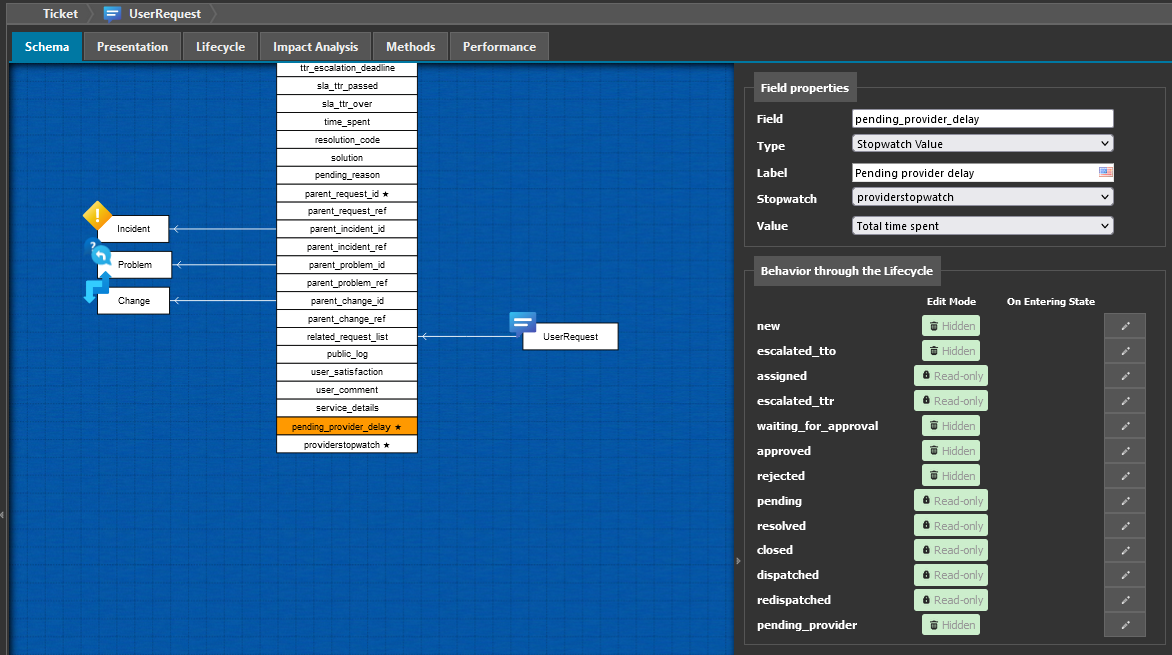
It's computed only when stopwatch is stopped
with an iTop Extension
Prerequisite: You must have already created an iTop extension.
Add a stopwatch
- itop_design / classes / class@UserRequest / fields
-
      <!-- Add a stopwatch to count the timespent in this state -->
      <field id="providerstopwatch" xsi:type="AttributeStopWatch" _delta="define">
        <states>
          <!-- here are the states during which the stopwatch is counting time -->
          <state id="pending_provider">pending_provider</state>
        </states>
        <working_time/>
        <thresholds/>
        <always_load_in_tables>true</always_load_in_tables>
      </field>
- itop_design / dictionaries / dictionary@EN US / entries
-
  <entry id="Class:UserRequest/Attribute:providerstopwatch" _delta="define">
    <![CDATA[Provider stopwatch]]>
  </entry>
-
This is the simplest use you can make of a stopwatch, just counting time spent in particular states
Track time spent
This step is mandatory to be able to display this information in a form and query it by OQL.
- itop_design / classes / class@UserRequest / fields
-
      <!-- Declaring this stopwatch sub-item is required to display or query it -->
      <field id="pending_provider_delay" xsi:type="AttributeSubItem" _delta="define">
        <target_attcode>providerstopwatch</target_attcode>
        <!-- Possible item_code: timespent, started, laststart, stopped  -->
        <item_code>timespent</item_code>
      </field>
    </fields>
-
You can also declare other sub-items.
- itop_design / dictionaries / dictionary@EN US / entries
-
  <entry id="Class:UserRequest/Attribute:pending_provider_delay" _delta="define">
    <![CDATA[Provider time spent]]>
  </entry>
Display Stopwatch
We will display the stopwatch it-self just for understanding its content. This field is rather special as it is a composite one, it contains sub-information, which are all displayed. We have decided to display the stopwatch all the time, regardless if it is running or not. You will see that the displayed data will not be available in some state.
Sub-items can also be displayed independently, assuming you have
declared them, as we just did for the sub-item
timespent. So we will also display the time spent.
- itop_design / classes / class@UserRequest
-
    <!-- Display the 2 new fields in the details of the UserRequest -->
    <presentation>
      <details _delta="must_exist">
        <items>
          <!-- First column of the UserRequest display -->
          <item id="col:col1">
            <items>
              <item id="fieldset:Ticket:moreinfo">
                <items>
                  <!-- Add the provider timespent delay -->
                  <item id="pending_provider_delay" _delta="define">
                    <rank>80</rank>
                  </item>
                  <!-- This displays a stopwatch (including some sub-items) -->
                  <!-- This will help you to understand how a stopwatch behave -->
                  <item id="providerstopwatch" _delta="define">
                    <rank>90</rank>
                  </item>
                </items>
                <rank>20</rank>
              </item>
            </items>
          </item>
        </items>
      </details>
    </presentation>
Display time spent
Because the time spent is only calculated when the stopwatch is stopping - so here when the UserRequest exits the “pending_provider” state -
-
it should not be displayed in state “pending_provider”, as it does not provide an accurate information
-
we decided not to display it in state “new”, as it's useless and empty
-
we decided to display it when the ticket is resolved or closed, in read only as it should not be modified by the user.
We have defined in the presentation, where that
field need to be displayed, now we can modulate
when it should be available, by defining for each
state, if this field should be hidden or read
only.
-
When we define a field to be
hiddenin statenew, as states are chained in standard datamodel, this propagates to all following states. -
When we define it to be read only in state
resolved, it overwrites thehiddenflag -
As
closedis changed toresolvedstate, it is still visible
- itop_design / classes / class@UserRequest
-
    <lifecycle>
      <states>
        <state id="new" _delta="must_exist">
          <flags>
            <!-- Hide the pending provider_delay, it will propagate to all chained states -->
            <attribute id="pending_provider_delay" _delta="define">
              <hidden/>
            </attribute>
          </flags>
        </state>
        <state id="resolved" _delta="must_exist">
          <flags>
            <attribute id="pending_provider_delay" _delta="define">
              <!-- Read_only takes precedence on hidden ??? -->
              <read_only/>
            </attribute>
          </flags>
        </state>
      </states>
    </lifecycle>
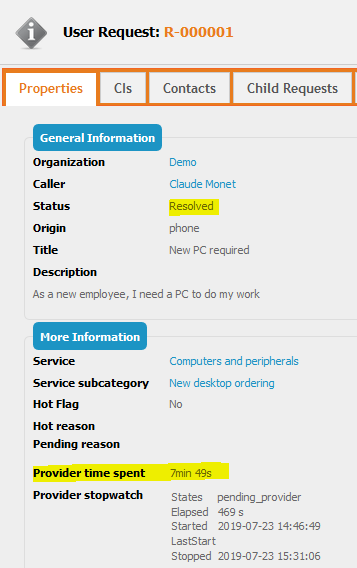
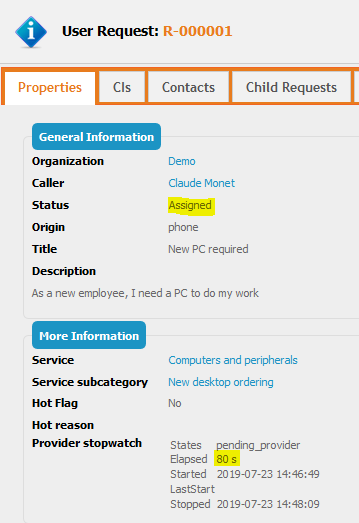
Here is the result on a User Request for which was moved three
time back and force between “Assigned” and “Pending provider”, as a
result, “Elapsed” does not correspond to the difference between
“Started” and “Stopped”. But you can see that 7*60s + 49s = 469s,
as “Provider time spent” is just a nice display of the “Elapsed”
sub-item (=timespent)
Full XML
Here is the consolidated XML for this tutorial
- itop_design
-
<classes>
  <class id="UserRequest">
    <fields>
      <!-- Add a new state value to the existing status -->
      <field id="status" _delta="must_exist">
        <values>
          <value id="pending_provider" _delta="define">pending_provider</value>
        </values>
      </field>
      <!-- Add a stopwatch to count the timespent in this state -->
      <field id="providerstopwatch" xsi:type="AttributeStopWatch" _delta="define">
        <states>
          <!-- this are the states, during which the stopwatch is counting time -->
          <state id="pending_provider">pending_provider</state>
        </states>
        <working_time/>
        <thresholds/>
        <always_load_in_tables>true</always_load_in_tables>
      </field>
      <!-- Declaring this stopwatch sub-item is required to display or query it -->
      <field id="pending_provider_delay" xsi:type="AttributeSubItem" _delta="define">
        <target_attcode>providerstopwatch</target_attcode>
        <!-- Possible item_code: timespent, started, laststart, stopped  -->
        <item_code>timespent</item_code>
      </field>
    </fields>
    <lifecycle>
      <stimuli>
        <!-- Add a new stimulus to switch to pending_provider state -->
        <stimulus _delta="define" id="ev_pending_provider" xsi:type="StimulusUserAction"/>
      </stimuli>
      <states>
        <!-- This level define the state we are in -->
        <state id="assigned" _delta="must_exist">
          <transitions>
            <!-- this define an available transition from the above state -->
            <transition id="ev_pending_provider" _delta="define">
              <!-- This define the stimulus which trigger the transition -->
              <!-- on a given state there can only be one transition triggered by a given stimulus -->
              <stimulus>ev_pending_provider</stimulus>
              <!-- This define on which state the UserRequest will end-up -->
              <target>pending_provider</target>
              <actions/>
            </transition>
          </transitions>
        </state>
        <!-- From the new state -->
        <state id="pending_provider" _delta="define">
          <flags /> <!-- Also empty it's a mandatory tag -->
          <transitions>
            <!-- we want to assign the ticket back to the support team -->
            <transition id="ev_assign">
              <stimulus>ev_assign</stimulus>
              <target>assigned</target>
              <actions/>
            </transition>
          </transitions>
          <!-- The fields are the same as in "assigned" state -->
          <inherit_flags_from>assigned</inherit_flags_from>
        </state>
        <state _delta="must_exist" id="new">
          <flags>
            <!-- Hide the pending provider_delay, it will propagate to all chained states -->
            <attribute id="pending_provider_delay" _delta="define">
              <hidden/>
            </attribute>
          </flags>
        </state>
        <state id="resolved" _delta="must_exist">
          <flags>
            <attribute id="pending_provider_delay" _delta="define">
              <!-- Read_only takes precedence on hidden ??? -->
              <read_only/>
            </attribute>
          </flags>
        </state>
      </states>
    </lifecycle>
    <!-- Display the 2 new fields in the details of the UserRequest -->
    <presentation>
      <details _delta="must_exist">
        <items>
          <!-- First column of the UserRequest display -->
          <item id="col:col0">
            <items>
              <item id="fieldset:Ticket:moreinfo">
                <items>
                  <!-- Add the provider timespent delay -->
                  <item id="pending_provider_delay" _delta="define">
                    <rank>80</rank>
                  </item>
                  <!-- This displays a stopwatch (including some sub-items) -->
                  <!-- This will help you to understand how a stopwatch behave -->
                  <item id="providerstopwatch" _delta="define">
                    <rank>90</rank>
                  </item>
                </items>
                <rank>20</rank>
              </item>
            </items>
          </item>
        </items>
      </details>
    </presentation>
  </class>
</classes>
<dictionaries>
  <dictionary id="EN US">
    <entries>
      <!-- Give a label to the new state -->
      <entry id="Class:UserRequest/Attribute:status/Value:pending_provider" _delta="define">
        <![CDATA[Pending provider]]>
      </entry>
      <entry id="Class:UserRequest/Attribute:pending_provider_delay" _delta="define">
        <![CDATA[Provider time spent]]>
      </entry>
      <entry id="Class:UserRequest/Stimulus:ev_pending_provider" _delta="define">
        <![CDATA[Wait for Provider]]>
      </entry>
      <entry id="Class:UserRequest/Attribute:providerstopwatch" _delta="define">
        <![CDATA[Provider stopwatch]]>
      </entry>
    </entries>
  </dictionary>
</dictionaries>
Behavior of the Stopwatch
In this part, we will show what the stopwatch contains along the User Request life
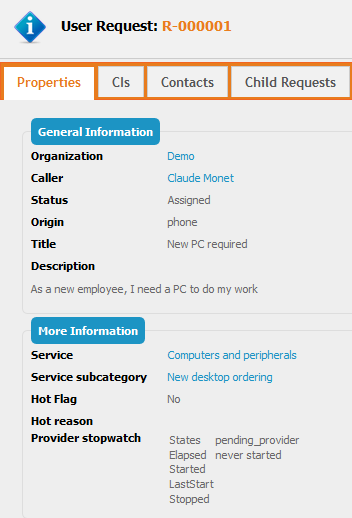
1. Stopwatch never started: 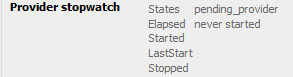
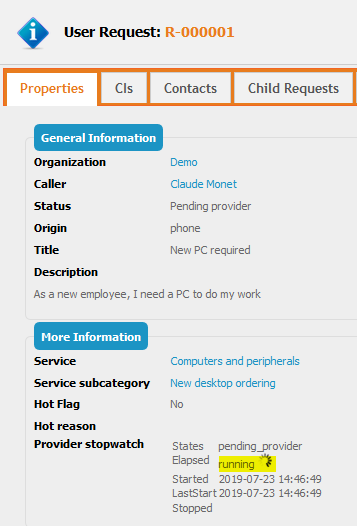
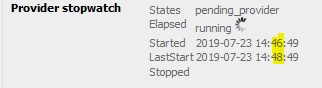
2. User Request is moved from “Assigned” to Pending provider for the first time:
-
stopwatch is running, so “Elapsed” (= timespent) is not available
-
“Started” and “LastStart” are equal
3. User Request is moved back from “Pending Provider” to Assigned for the first time:
-
stopwatch is stopped, so “Elapsed” (= timespent) is available
-
“LastStart” is empty when not running
-
“Stopped” is documented
4. User Request is moved again from “Assigned” to Pending provider:
-
stopwatch is running, so “Elapsed” (= timespent) is not available
-
“Started” is unchanged
-
“LastStart” correspond to the last time the stopwatch has started
-
“Stopped” is empty when running
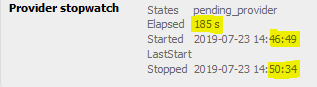
5. User Request is moved back again from “Pending Provider” to Assigned:
-
stopwatch is stopped, so “Elapsed” (= timespent) is available
-
“Started” is unchanged
-
“LastStart” is empty again, as the stopwatch is stopped
-
“Stopped” is documented again and correspond to the last stop
-
Note that “Elapsed” is not equal to the difference between “Started” and “Stopped”
A stopwatch is automatically computed and cannot be edited by a
user: