Editing Dashboards
Some of the pages in iTop are dashboards. Dashboards are used to display information about different iTop objects on the same page. Most of the overview pages, as well as the welcome page are dashboards. In iTop 2.0, each user can configure their own dashboards by editing the existing dashboard pages. It is not possible to create new dashboard pages.
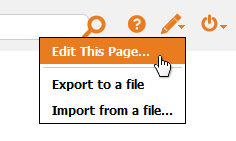
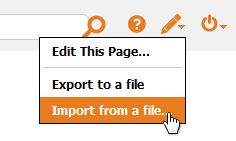
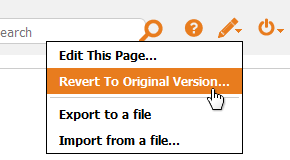
When a page is an editable dashboard, the small Pen drop-down menu appears at the top-right of the page, next to the Log-off menu.
To edit the current page, select Edit this page.
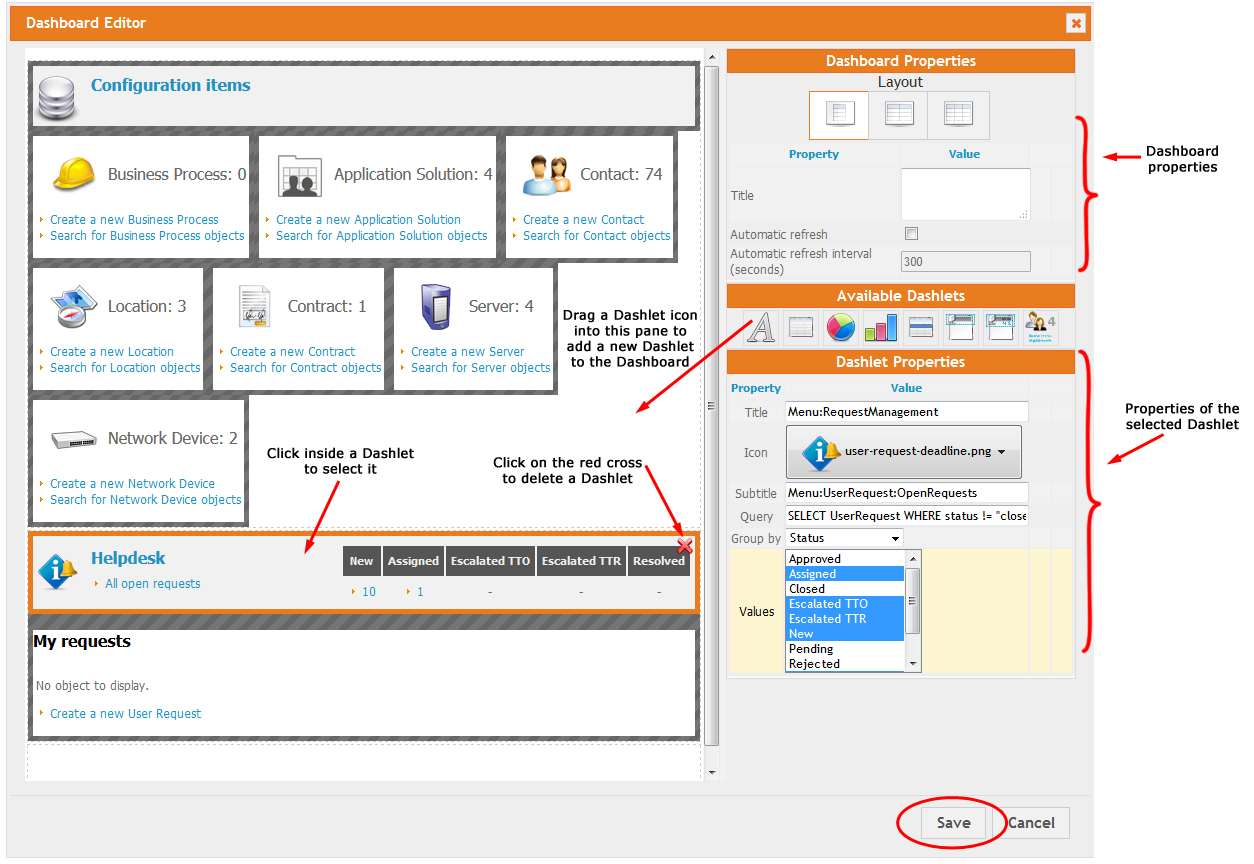
After a few seconds a popup dialog appears containing the dashboard editor dialog:
A dashboard is made of building blocks named after dashlets.
A dashboard itself arranges the display of the dashlets it contains. A dashboard has only three properties:
-
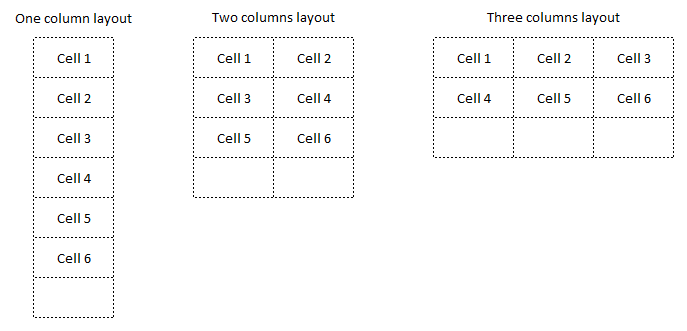
A layout (one, two or three columns)
-
An optional title
-
The automatic refresh setting (disabled, or refresh interval given in seconds)
The layout determines how the dashlets are arranged on the page: it determines a grid, with each dashlet being assigned to one cell of the grid. When the layout is changed, the cells (as well as the dashlets inside the cells) are re-organized to produce the desired display.
To edit the properties of a dashlet, click on it in the left part of the dialog. An orange border appears around the selected dashlet, and the properties of the dashlets are displayed on the right part of the dialog. To modify the appearence of the dashlet, simply modify the properties on the right. The dashlet will change to reflect your modifications. To remove the selected dashlet from the dashboard, click on the red cross at the top-right of the selected dashlet.
To add a new dashlet to the dashboard, drag one of the dashlet icons into the desired area of the dashboard, then adjust the properties on the right to finalize your dashboard.
When you are done with editing, click on Save to save your modifications and go back to the iTop page.
To undo all modifications performed since clicking on Edit this page, click on Cancel.
Dashlet types
The following types of dashlets are available to compose your dashboard:
Exporting a dashboard
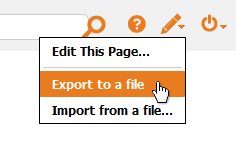
A dashboard definition can be exported as an XML file, for archiving or sharing it with other users. To export a dashboard, click on the menu item Export to file from the Pen popup menu. When prompted, enter the download location (Where the exported dashboard will be saved to on your computer).
Importing a dashboard
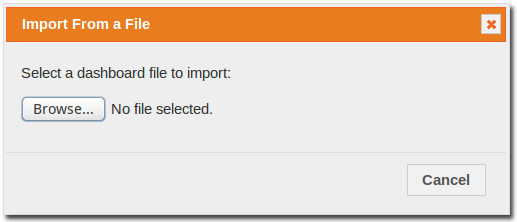
To import a dashboard definition from an XML file, click on Import from file and select the XML file to upload from your computer.

